The No. 1 Market Rule in the Republic...
What are you not supposed to be without when the music stops?
Dear Fellow Expat:
As a trader an investor, you likely learned everything you needed in your first day of school.
When you were a kindergarten student, you learned to follow patterns.
You learned from mistakes. You adapted to surprises, built relationships, embraced repetition, and handled ups and downs.
There’s one lesson they don’t explicitly teach you.
But it was there the entire time.
Were you paying attention?
Momentum, Liquidity, and What Comes Next
The most important rule as an investor and trader remains the same.
Imagine being five years old. The teacher turns on a song.
The music plays.
You and other children walk around a circle of chairs.
But the number of chairs is one less than the number of students circling them.
The music slows… and then it stops.
Everyone tries to find an open seat.
One child is left standing as the music stops.
You might have cried if you lost that game.
But it’s a lot worse when you’re in the financial markets. If you get caught without a chair… or holding the bag… or any other metaphor… you’ll feel real pain.
At Republic Research, our most important market rule remains the same.
Never be the one without a chair when the music stops.
Let’s look at ways that you can avoid that fate.
What To Watch No. 1: The MOVE Index
As Michael Howell notes, Money moves markets. We’ve heard other investors like Ray Dalio and Stanley Druckenmiller argue this for decades. But there’s an important distinction that we must make. We focus on Liquidity in the financial system.
Liquidity is all capital in the global system. But what’s done with liquidity is what matters. Liquidity is necessary to pay off or REFINANCE existing debt. Today, Howell notes that six out of every seven dollars is used to refinance existing debt. And when there’s not enough capital to refinance, we start to see cracks in the system.
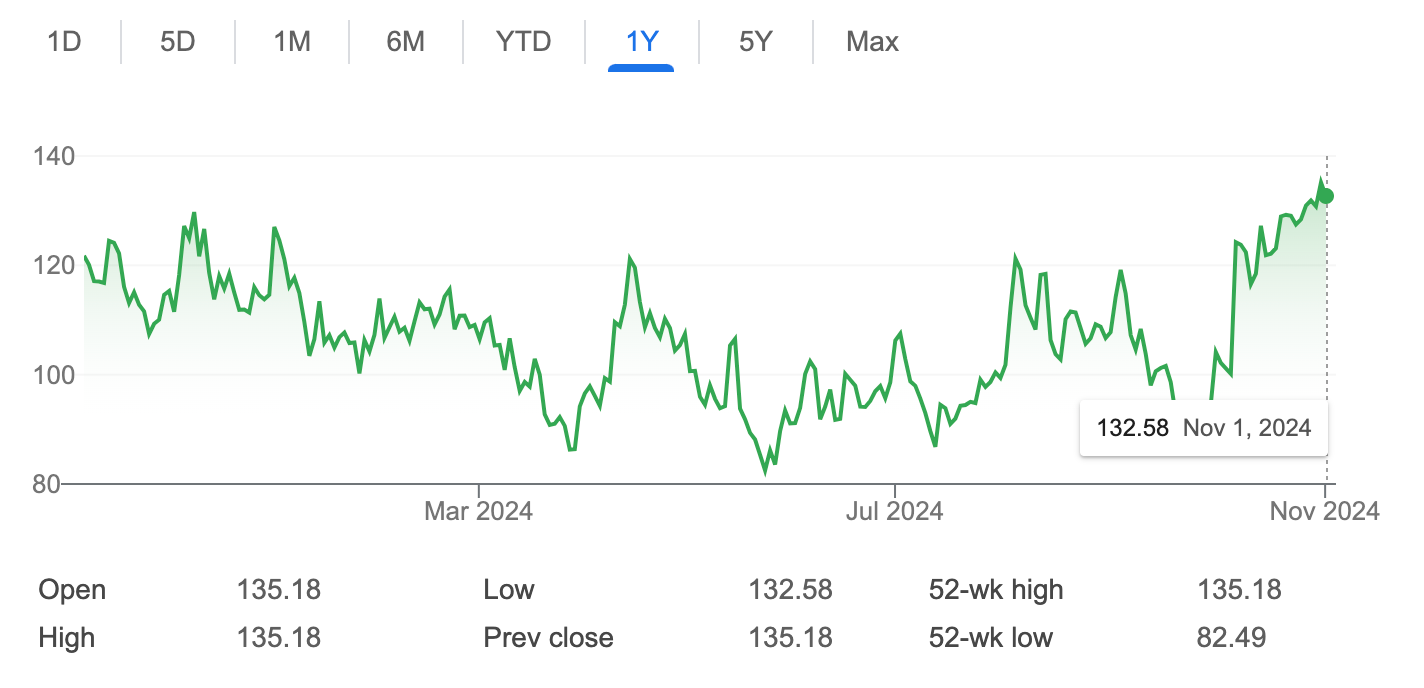
The MOVE Index is a critical barometer for the debt markets. It measures U.S. Treasury bond volatility, much like the CBOE Volatility Index (VIX) does for stocks. A higher level suggests that we’ll see bigger swings in bond prices (and potentially much higher yields). That is a potential sign of uncertainty or instability. High values indicate more volatility, while low values suggest steadier markets.
Right now, the MOVE index is at its highest level since October 2023, the height of the bond selloff that pushed the 10-year bond to roughly 5%. This is a Google snapshot of price movement on this index over the last 12 months.
It’s telling us that bond buyers are demanding MORE yield, and it’s signaling that we could see problems with global liquidity in the foreseeable future. More so - it also suggests that we might see the Federal Reserve step in at some point to cool the bond markets with… you guessed it… more stimulus.
What To Watch No. 2: MACD and the Momentum Technicals
The MACD, or Moving Average Convergence Divergence, is a tool traders use to spot trends. It shows when momentum in a stock is building up or slowing down, helping traders decide when to buy or sell. Think of it like a "trend radar" for stock movement.
It shows the difference between two moving averages—a short-term (typically 12-day) and a long-term (typically 26-day) average. When the shorter average crosses above the longer one, it suggests a possible upward trend, while crossing below can signal a downtrend. It essentially gauges the strength and direction of a trend.
The MACD is an important signal in that it typically proceeds movements in other momentum technical indicators like the Relative Strength Index, the Money Flow Index, and the ADX. As I’ve noted, following those four indicators together on the S&P 500 ETF (SPY) and Russell 2000 ETF (IWM) can help you understand the state of affairs in the market - and tell you when to hedge or take profits.
What To Watch No. 3: Insider Buying
The most important chart in my worldview is the state of insider buying on the aggregate. We watch insider buying on the aggregate because it gives us a sense of when markets are overbought and oversold.
However, it also tends to coincide with major policy shifts and confidence that central banks are patching up the global system. As we’ve noted, insider buying levels have been their strongest over the last decade at period of oversold levels combined with major policy shifts, global liquidity bottoms, and the onset of major stimulus programs.
The aggregate is a signal to the rest of us that it’s time to buy. When this blue line hits the extreme levels on the top, it tells us that everyone is jumping back into the pool and a broader market catalyst is driving optimism.
Meanwhile, extreme selling suggests that insiders are not optimistic at this moment and prefer to sit on cash or other assets until there is justification to buy a lot of their stock.
Or Just Do This
You can try to piece together all of the different tools available in the markets.
Or you can just follow our signal. Our signal has preceded every major selloff dating back to 2022, when we first started publishing it. In addition, our Green signals (aligned with central bank activity and liquidity expansion) have preceded major rallies. The chart below offers a glimpse of where our risk barometer has shifted.
The most recent - HUGE event happened on August 1, four days before the massive implosion of the Japanese markets. Meanwhile, we are still in negative territory at the moment, waiting for the source of our current negative momentum conditions.


